Unlocking the Importance of Structure: Data vs Keys
Biotech R&D generates a vast and complex web of experimental data. To make informed decisions and drive analyses forward, the data needs to be organized, structured, and accessible — something that is often taken for granted. In this Kaleidoscope post, we cover the essential difference between keys vs data, and provide practical tips on how to tell the difference between the two, in your data.
The quantity of data biotechs are generating is staggering. From gene expression profiles to high-throughput screening results, the potential for deriving critical insights is endless – but only if that data is actionable.
It’s a common refrain that most of a data scientist’s time (up to 80%!!!) is spent cleaning and prepping data before they can actually analyze it. Why does it take so long? On the large scale, things like inconsistency in nomenclature and differences in database structure can certainly take time to overcome. But seemingly simple choices made when setting up results tables for one-off experiments can also become nightmares for later analyses.
Take, for example, these three tables with data from a recent set of example experiments:
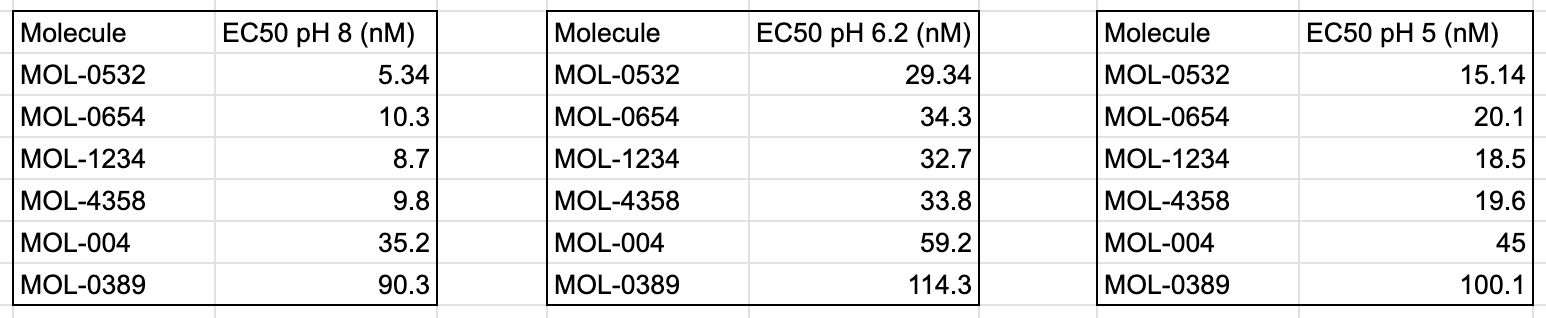
Though these tables have very similar pieces of information in them, it isn’t immediately clear how to merge them for analysis in the same data table. Do you just append the additional columns? What about when another pH level gets tested? How about comparing across different pHs? Or plotting all these values onto one graph? As the information being gathered grows, inconsistent choices made while merging this kind of data together can lead to headaches and unwieldy spreadsheets down the road (along with other issues).
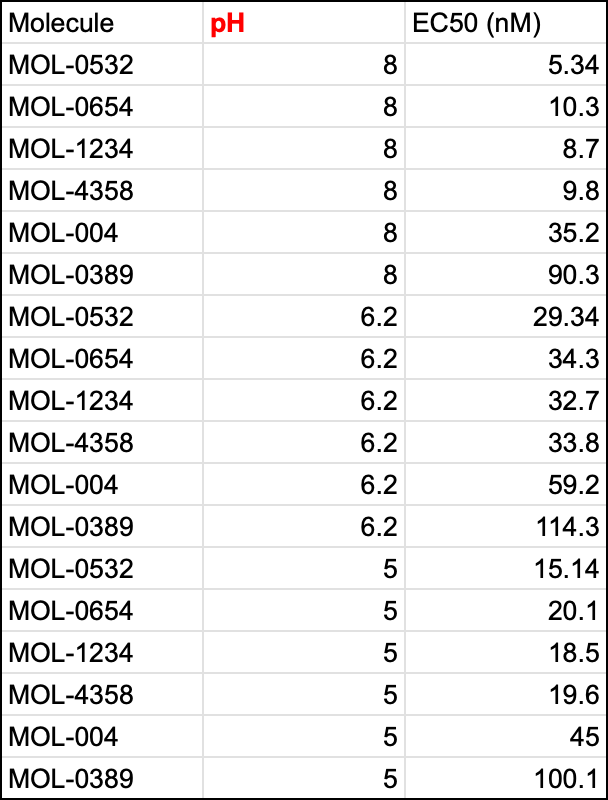
Restructuring the table to more accurately separate out pH as a “key” enables more direct comparisons to be made on this data and sets it up for additional information capture.
So what exactly is a “key” field and how can you know which fields qualify? Read on to advance your understanding of structured data and prepare to take your analytics to the next level (+ reduce headaches along the way).
Keys vs Data
To extract meaningful insights, it's vital to understand the core building blocks of structured data. Let's start by differentiating between Keys and Data:
- Keys: The Unique Identifiers. Keys act like "names" for your data points. They're distinct labels, such as compound IDs, batch numbers, sample codes, or patient numbers. Keys make each record individually identifiable and traceable, and work in combination to define the uniqueness of a data point. In the context of an experiment, they are often things like condition, temperature, dose, replicate, preparation — any numerical or categorizable value that differentiates your results in meaningful ways.
- Data: The Measurable Values. Data encompasses the actual information you want to capture and/or analyze. This includes experimental results, gene expression levels, drug responses, or any other relevant value or attribute.
The Messy Reality: Unfortunately, experimental values often lack a clear separation between keys and data. Identifying information might get mixed with results, data can be fragmented, and inconsistencies can creep in. Moreover, context is critically important! A drug concentration might be a resulting data readout in one type of experiment while it might be considered a key when testing multiple concentrations in an efficacy experiment.
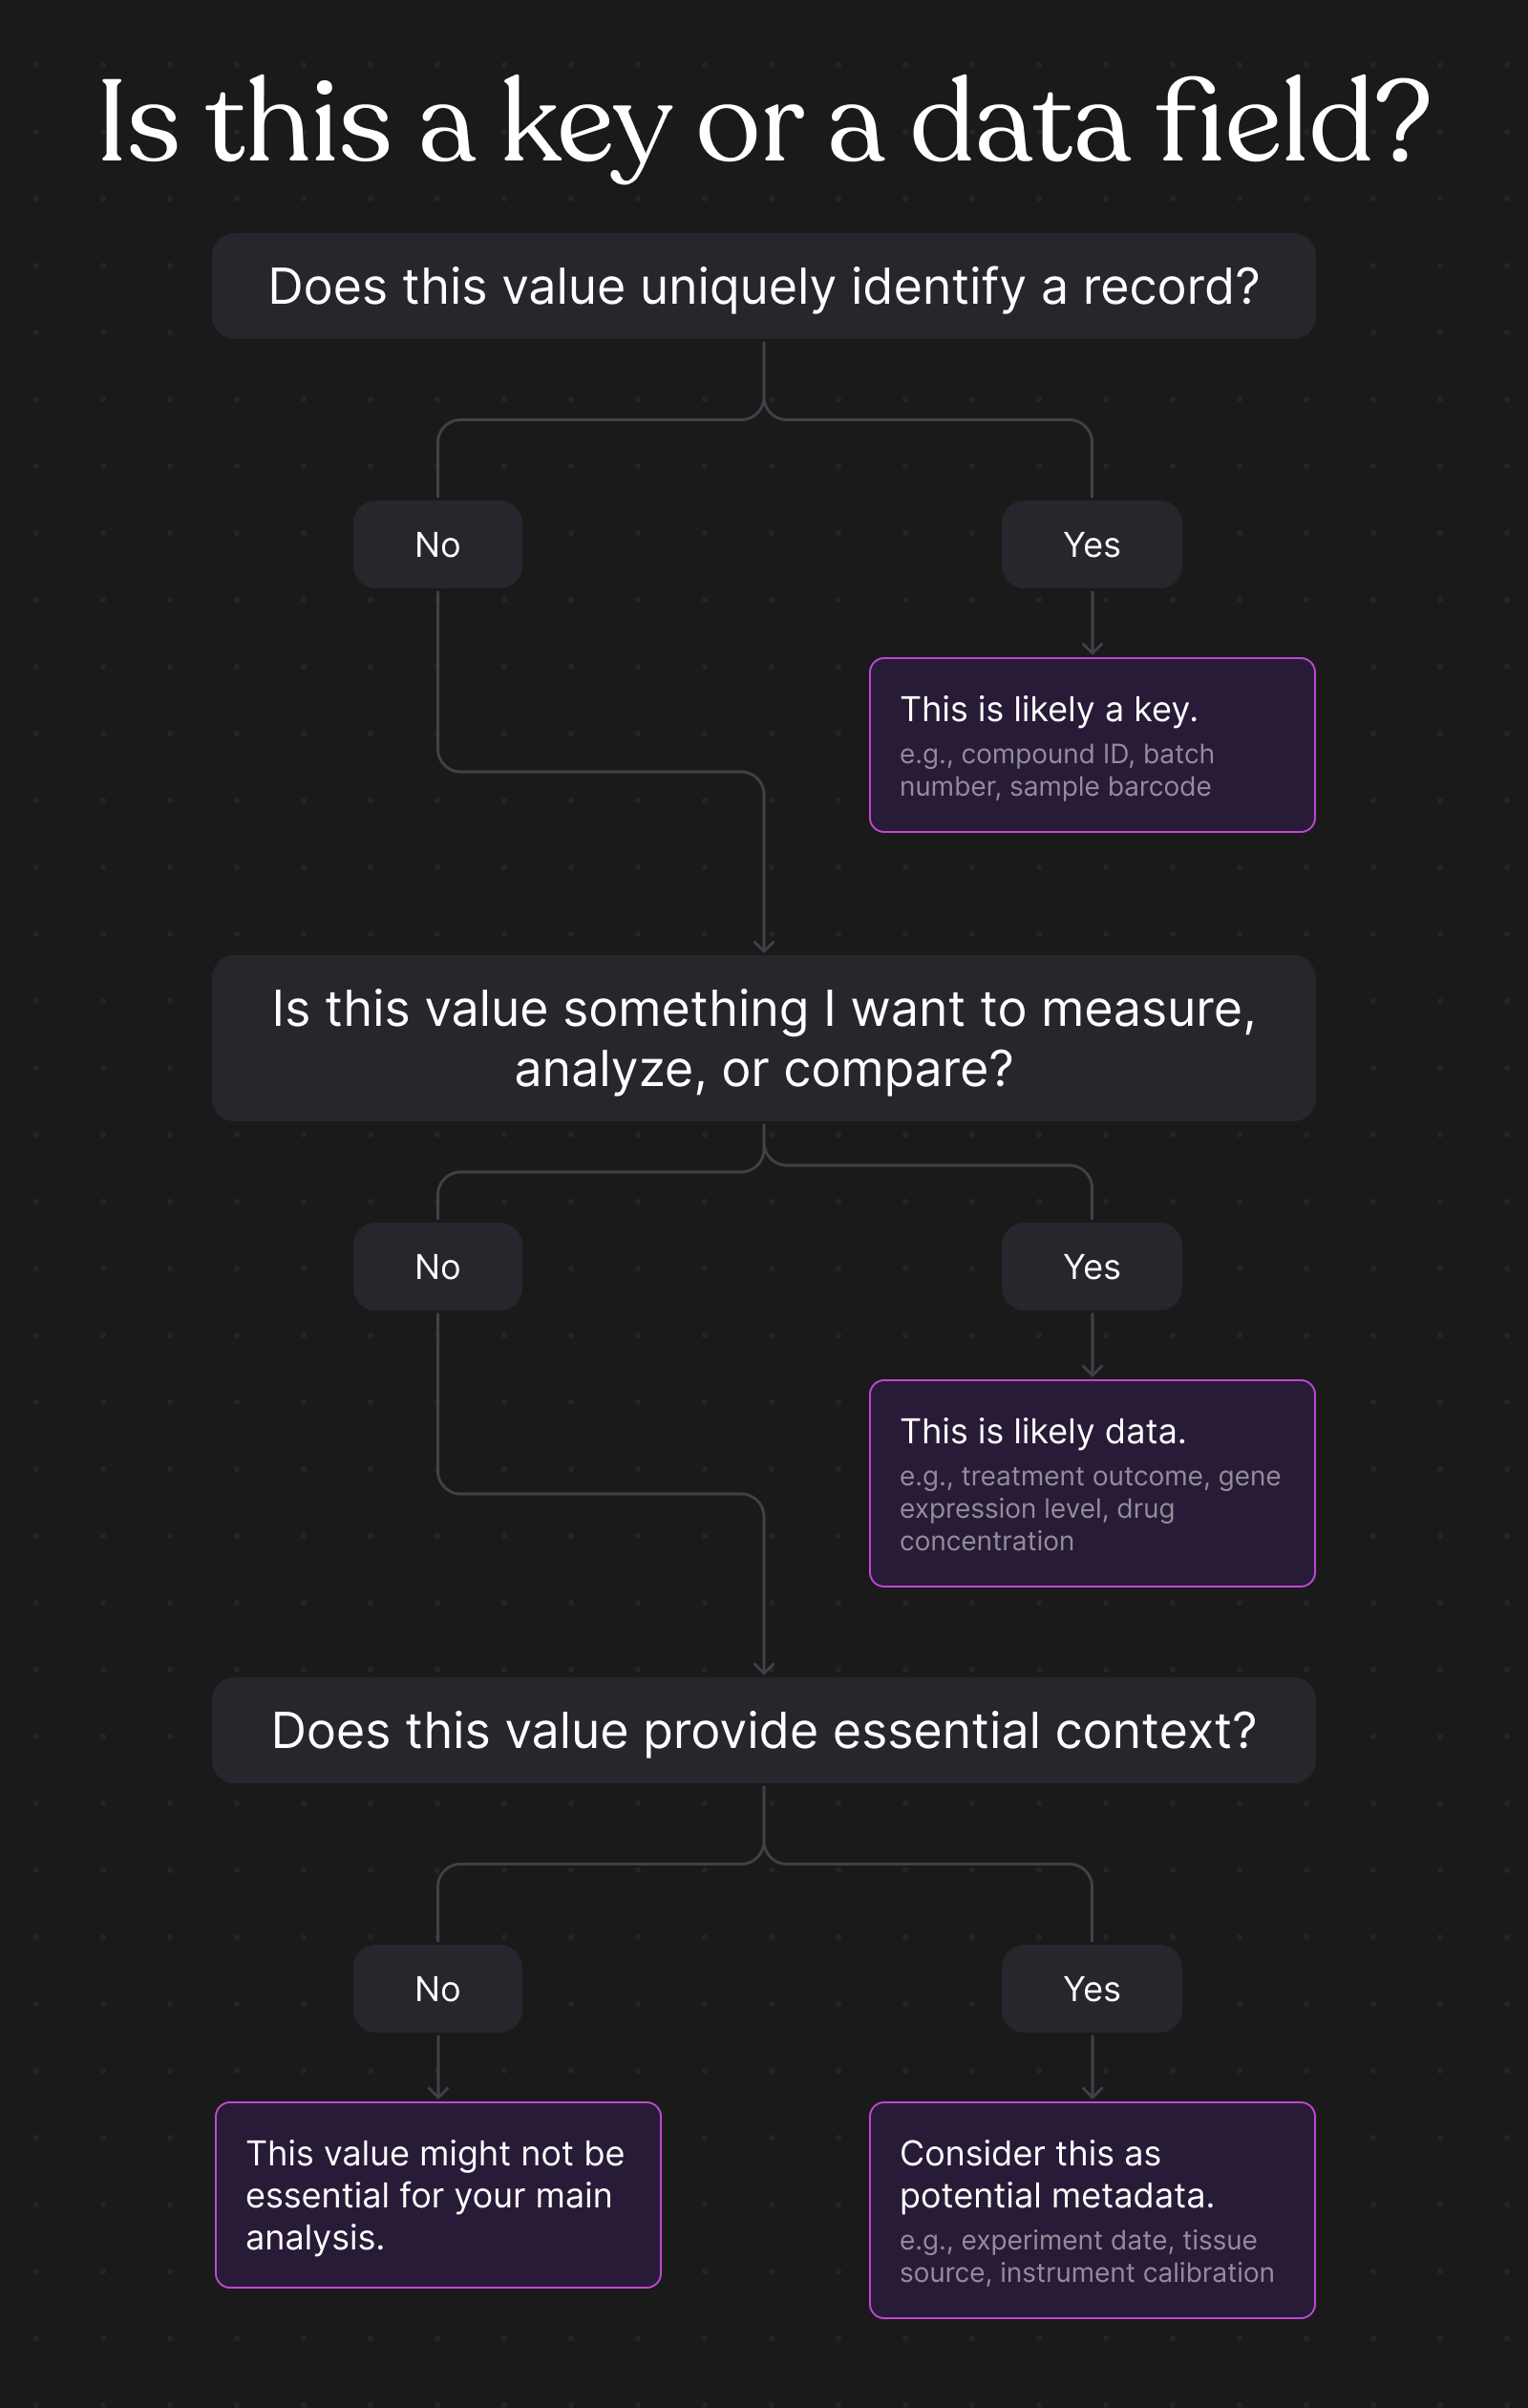
When faced with an incoming set of data try using this flow chart to help determine which pieces are data and which are keys:
Why the Distinction Matters
Separating keys from data, and making sure nomenclature is consistent, is essential for data organization and analysis. Taking the time upfront to delineate between the two will set up your team for data driven success. This kind of intentional structuring will enable:
- Data Linking: Keys allow you to connect related data points across different datasets, revealing patterns and associations. For example, a compound's unique ID (key) lets you associate synthesis information, experimental readouts, and other relevant data.
- Efficient Analysis: Well-structured data, with clearly defined keys, flows more effortlessly into analysis tools. This means less time spent restructuring information and more time focusing on scientific questions.
- Error Reduction: Confusing keys with data increases the risk of mismatches and inaccuracies. Clear separation helps ensure you're analyzing the correct information.
- AI Readiness: As the saying goes with models, garbage in garbage out. Having well maintained data will ensure your team can make the most of new AI tools and analytics without having to waste time restructuring it beforehand.
How Kaleidoscope Enables Structured Data
Kaleidoscope was built with the power of structured data in mind. By setting up your workspace with keys and data fields delineated, we take care of the piping needed to collate disparate experimental information together. From there, you can quickly search, summarize, and analyze your data based on any key groupings that make sense for the question at hand.
Establishing these structured data templates at the outset of your environment set up will ensure your whole team is aligned on data management and storage throughout your use of Kaleidoscope. Reach out to us if you have any questions on what makes the most sense for your data — we’re happy to help!
If you want to chat more about anything we wrote, or you’re interested in finding a way to work together, let us know!